
IrisX Analytics to Power BI
In this article, we will show you how to connect IrisX Analytics to Power BI to access data in your IrisX Data Lake.
Getting started: Set up the connection
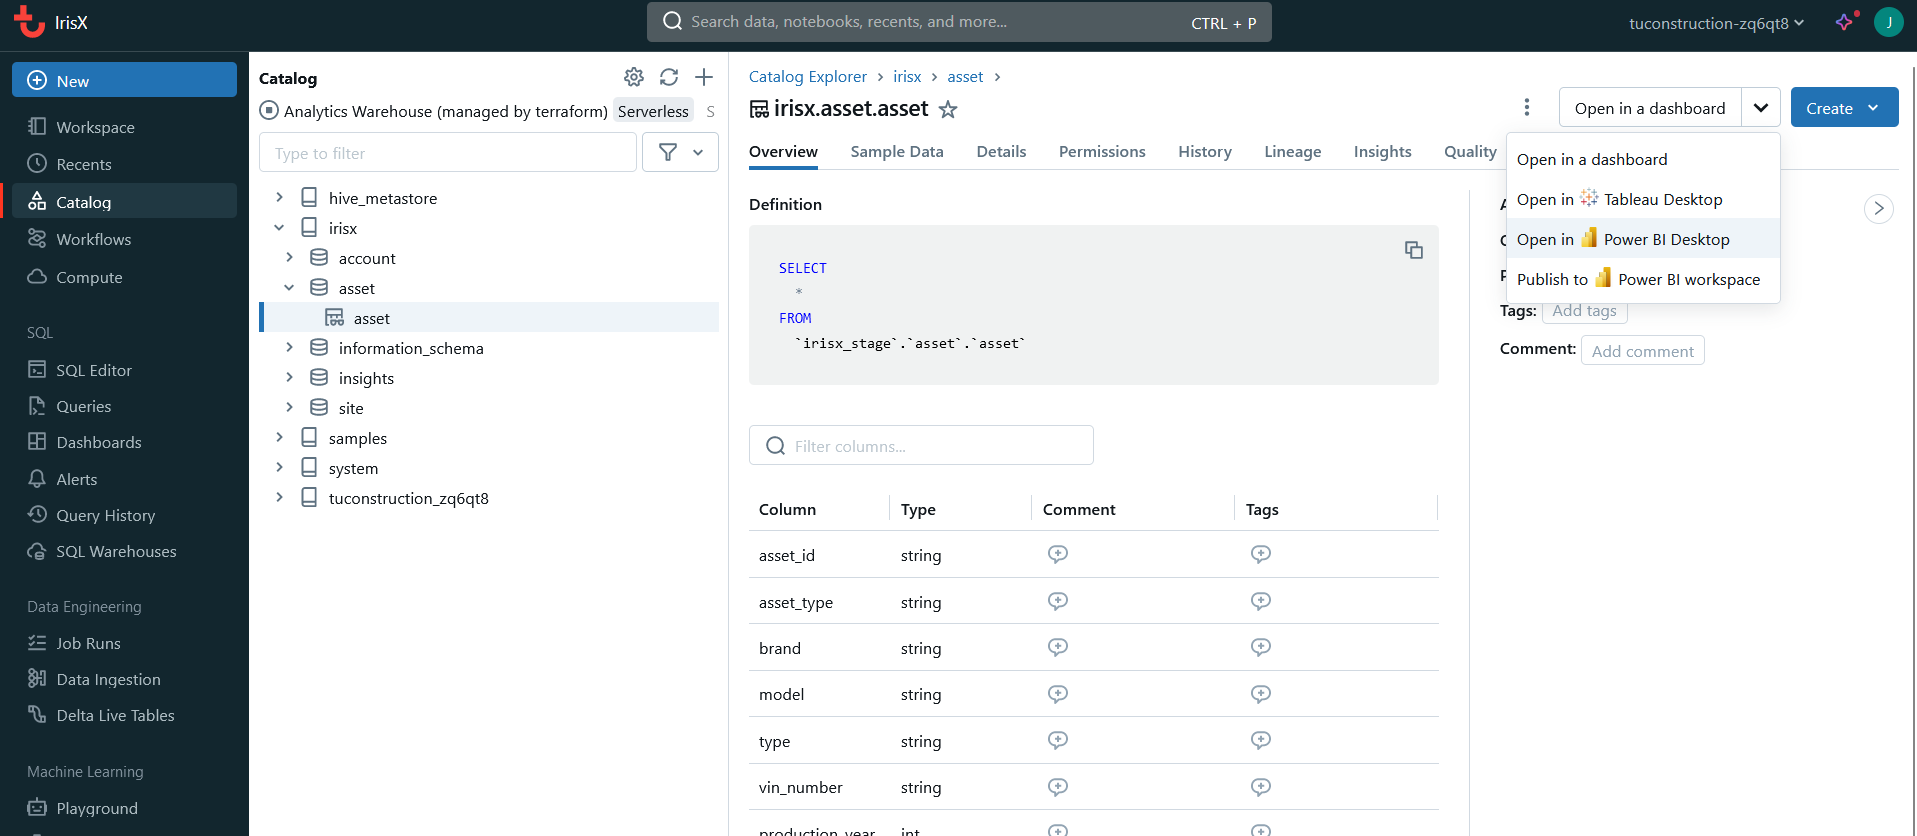
In your IrisX Analytics instance, find the "Open in PowerBI" option:
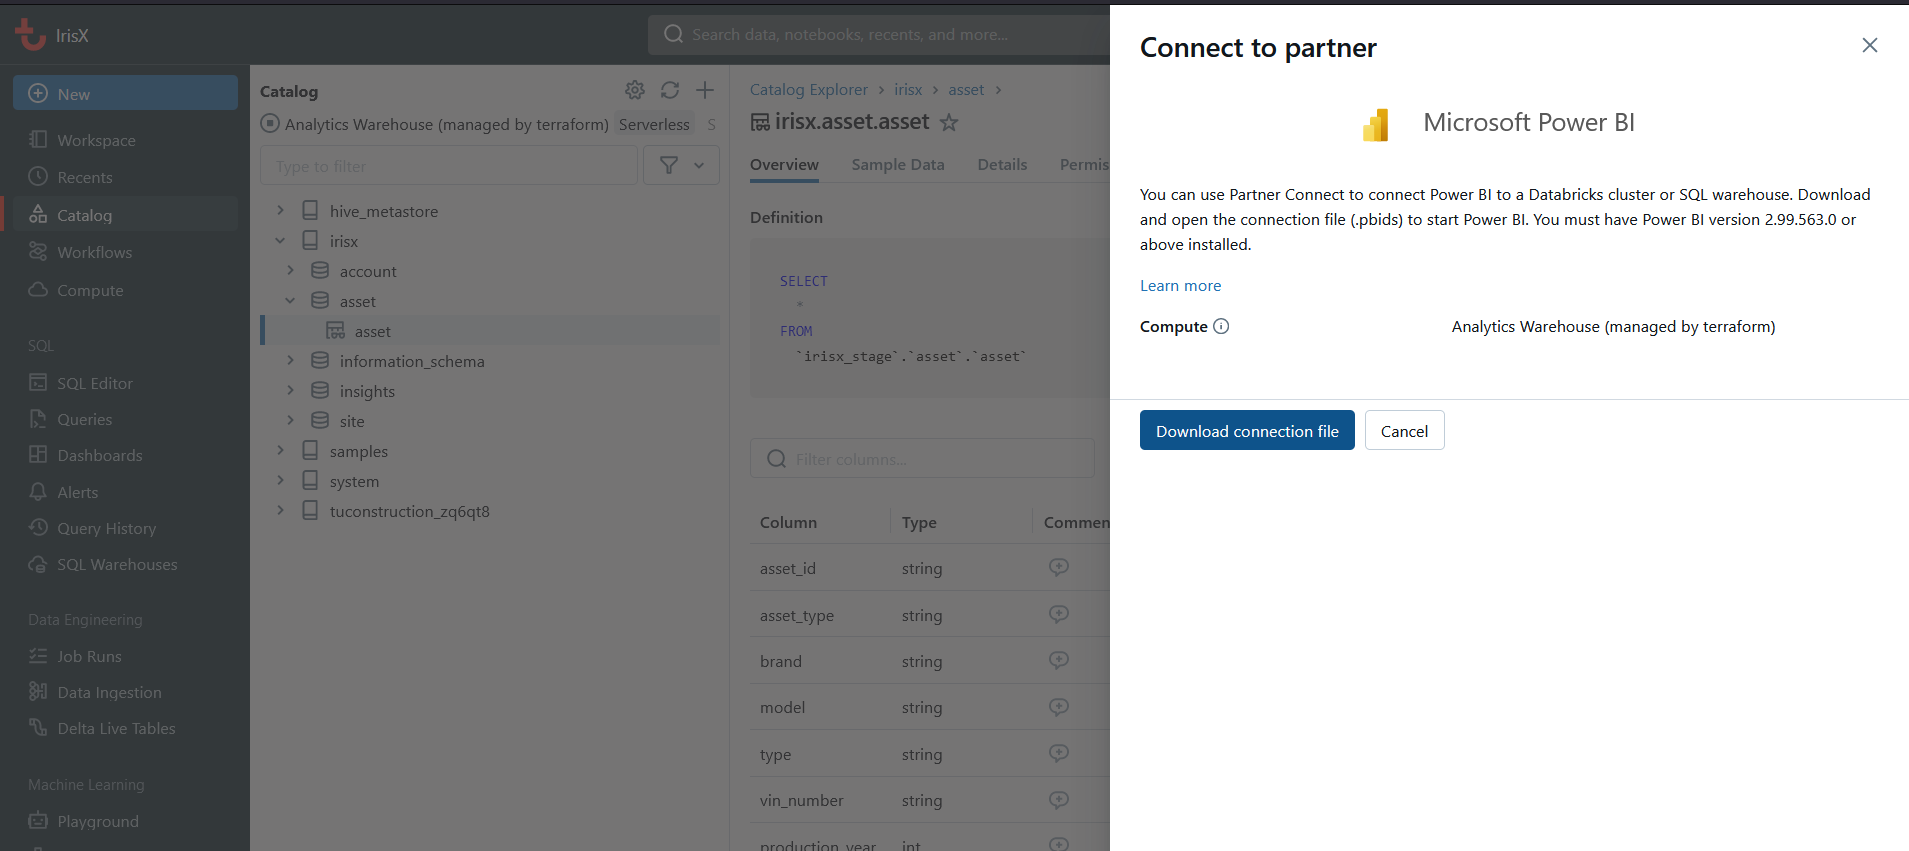
Download the connection file:
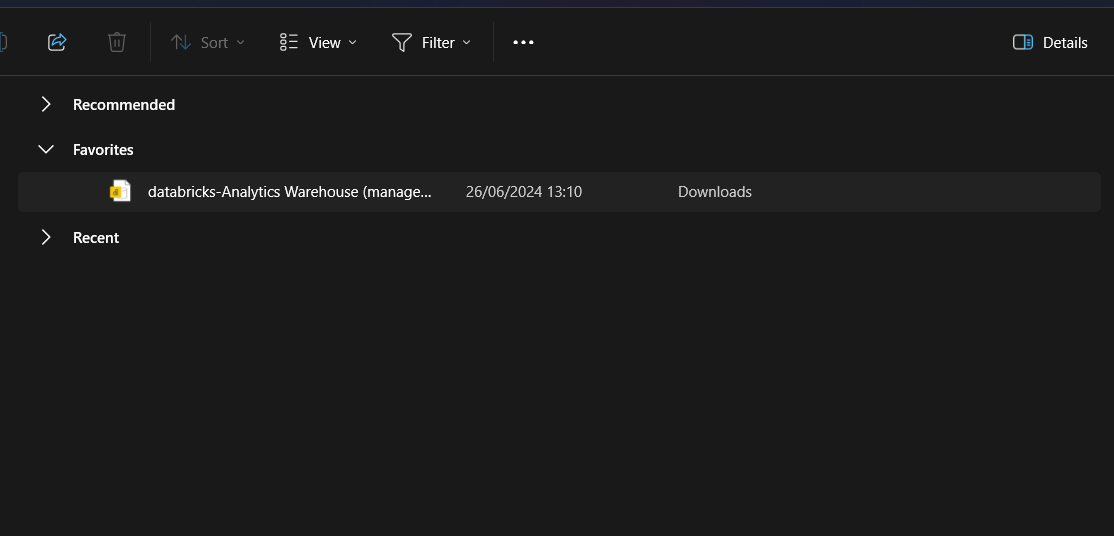
Open the connection file:
Authenticate your access with your username and password:

Now you have quickly connected data to your Power BI instance, by using the PowerBI connection file from the catalog browser.
Performance Considerations and Best Practices
Power BI and most other BI tools work on data volumes up to a few million records. Telematics data alone for a single machine is typically of this size. IrisX Analytics uses advanced compute and processing technology to handle these amounts of data. In order to use this data in your BI tool, it is typically necessary to preprocess the data in some way.
There are two basic ways of accessing IrisX data with Power BI:
- Direct Integration: Whenever you query the data lake for data you push the calculations to the data lake, to take advantage of the scalability of computation in IrisX Analytics.
- Custom BI Tables: Tables suited for use in Power BI are precomputed and ready when queried.
When choosing between these methods, you should consider the following aspects. Unless you know you will need the flexibility of a direct integration, we recommend using IrisX Analytics to create precalculated data sets for consumption in Power BI.
- Performance: Direct integration offers real-time insights but can be resource-intensive, while custom BI tables can offer better performance through pre-calculated summaries.
- Complexity of Reports: Direct integration allows for more flexible and detailed reports, while custom BI tables are better for simpler, high-level overviews.
- Maintenance: Custom BI tables may require additional maintenance if business requirements change, as they may need to be redefined within IrisX Analytics.
- Reusability: If you think you might use the same datasets and aggregations in multiple Power BI reports, we recommend precomputing these in IrisX Analytics, mapping the results in Power BI once, and reusing the data set across reports.
Use the following diagram to guide your choice. Map your use case to the axes shown to get an indication of the recommended approach.

Updated 6 months ago