Viewing serverside function logs
⚠️ Early Access — Serverside API Extensions and their logs are currently in early access. Contact your Trackunit representative for more information.
When your IrisX App includes Serverside API Extensions, you can inspect what those functions log from the Developer Console in Trackunit Manager — without internal tooling.
This guide walks through the end-to-end journey: use serverside functions, emit console output, then open the Logs tab to filter, search, follow live entries, and inspect details.
Serverside function logs are available in the Developer Console UI today. There is no public programmatic API for fetching these logs.
Prerequisites
- You are registered as a developer and can use the Developer Console.
- You own the IrisX App (or it is owned-and-approved for your account).
- The app’s published/approved manifest includes at least one Serverside API Extension.
If the app has no serverside extensions, the Logs tab does not appear.
Emit log output from your function
Serverside API Extensions run as managed server-side functions. For how to create and call them, see Calling external APIs from an Iris App (Server-side execution).
Standard console output from your function appears in the Logs tab. Prefer the usual console methods (console.log, console.info, console.warn, console.error) so severity is easy to filter later.
Open the Logs tab
- Open Trackunit Manager and go to Developer Console.
- Open the IrisX App you own that has serverside extensions.
- Select the Logs tab.
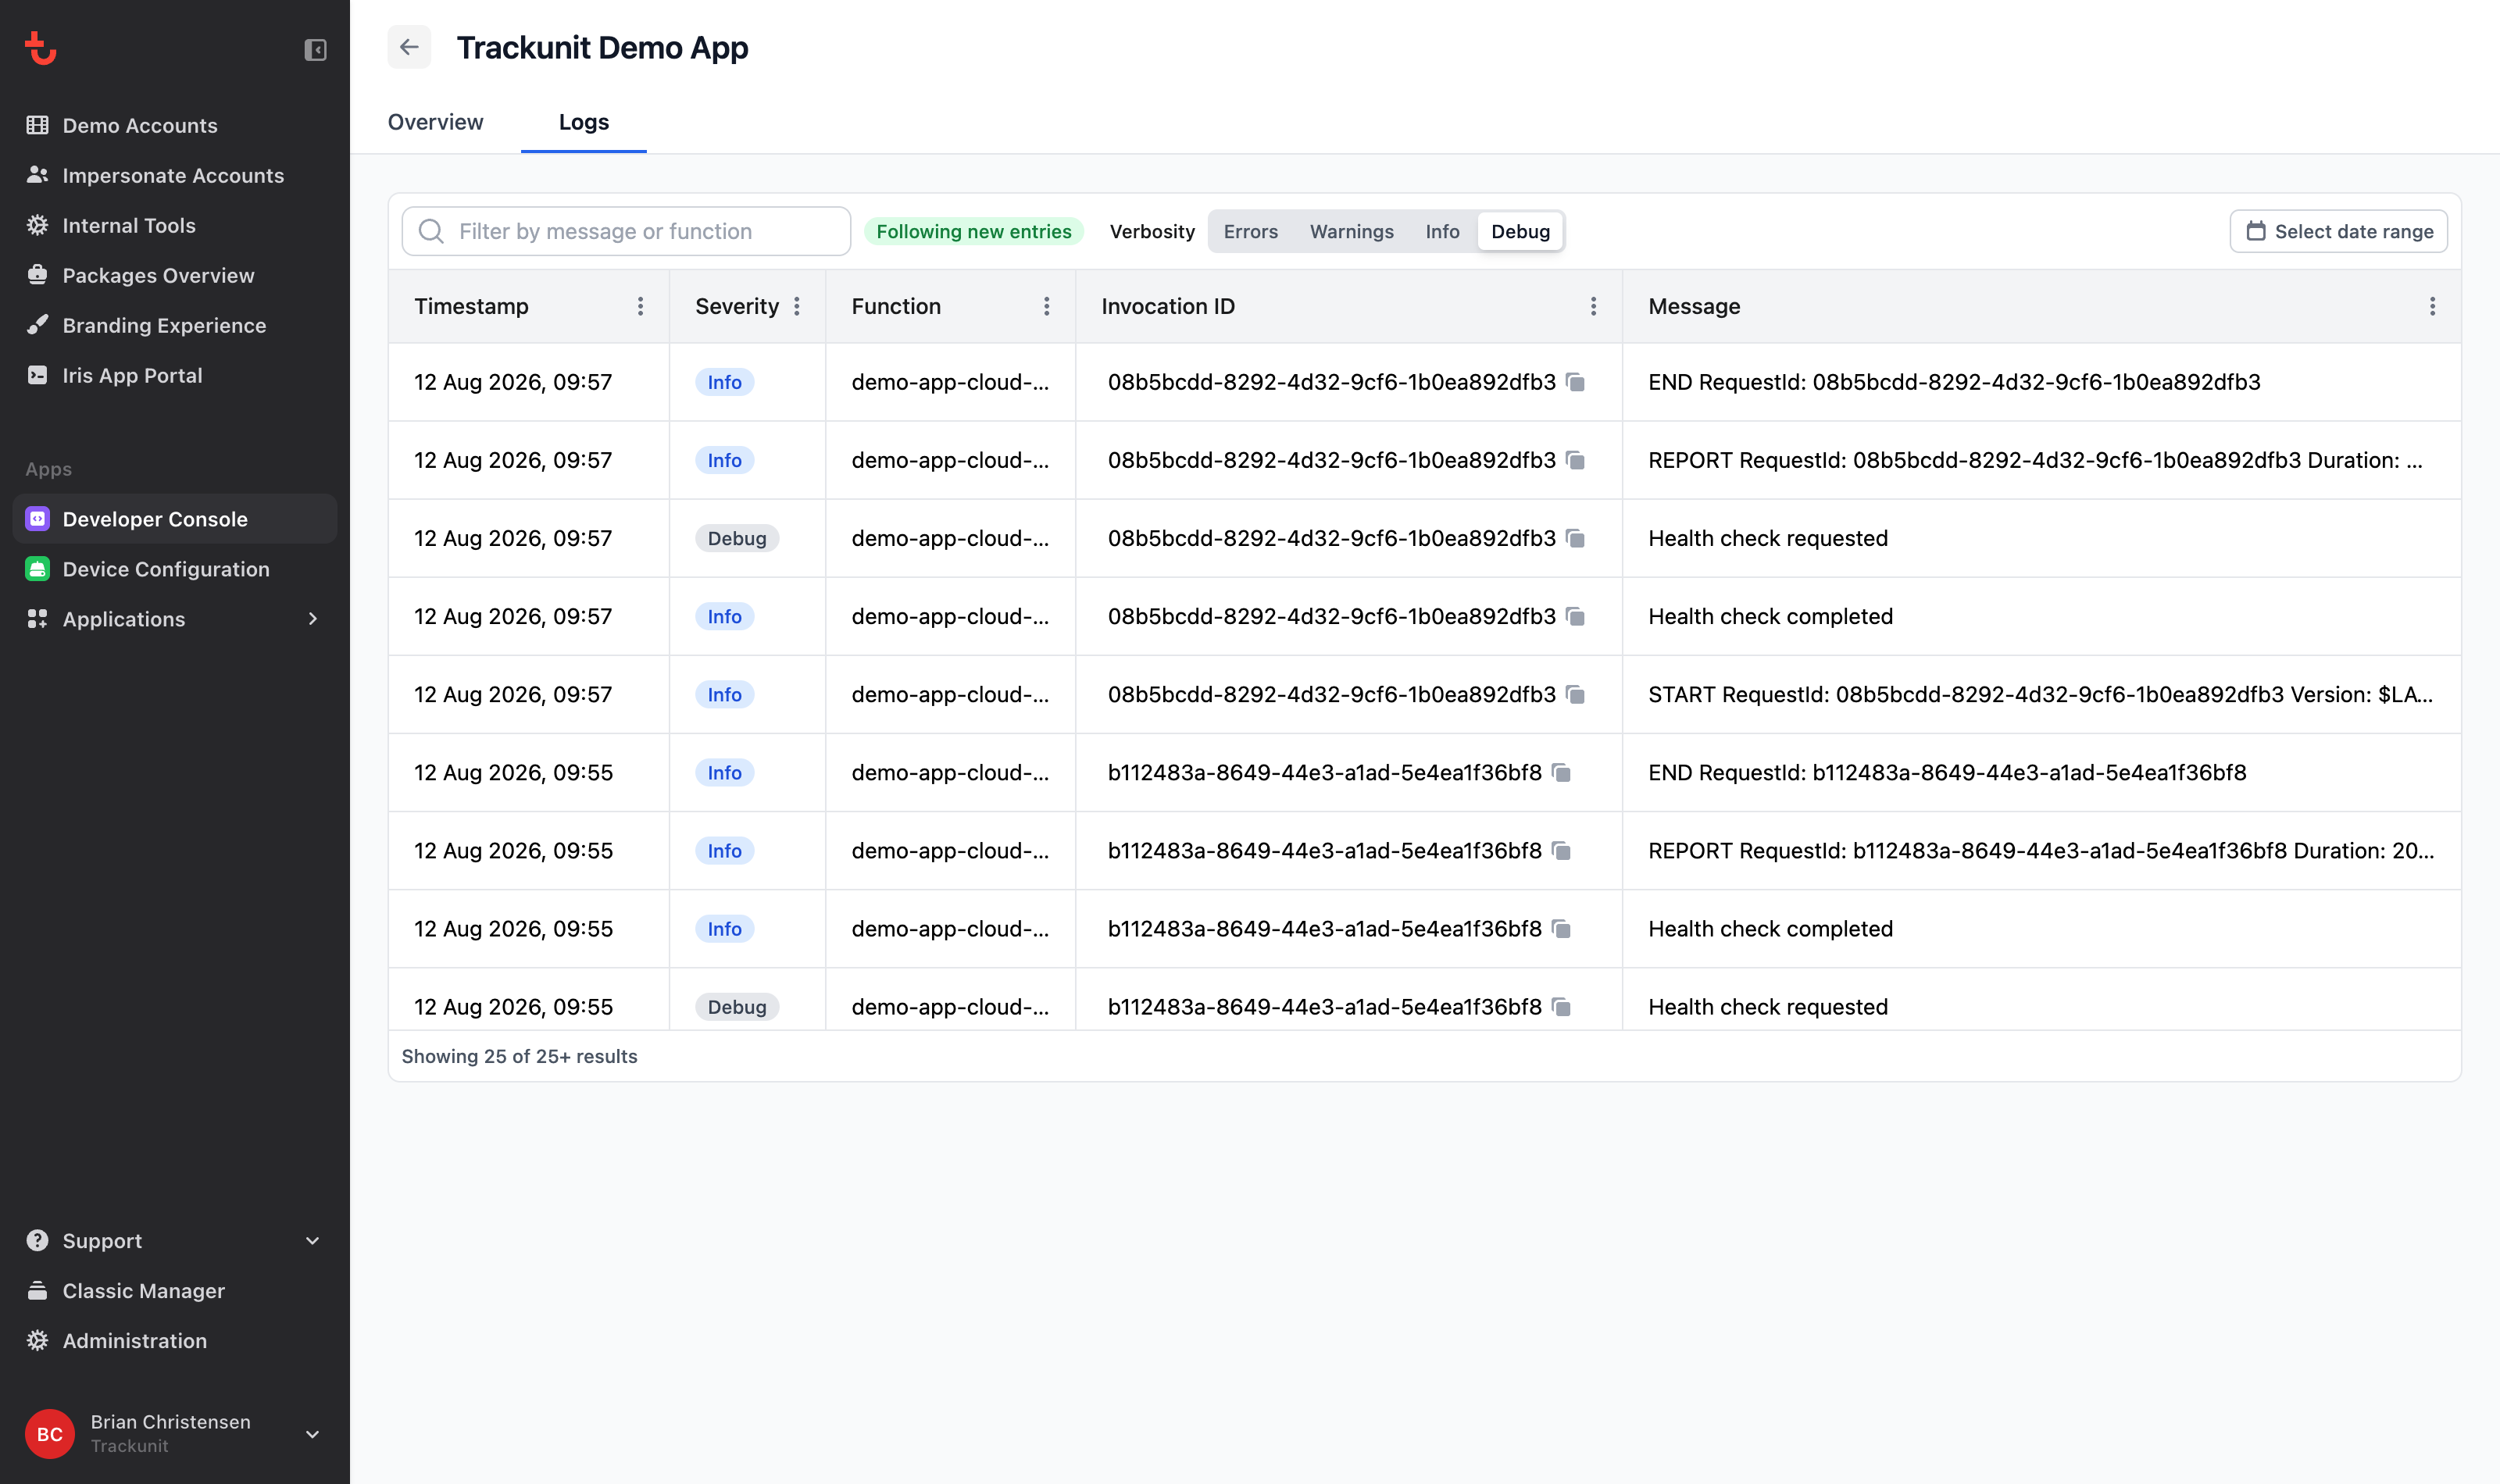
Only the app owner can view these logs. If you are not the owner, you will see that you don’t have access.
Filter and search history
Use the controls above the table to narrow historical entries:
| Control | What it does |
|---|---|
| Date range | Limits entries to a time window. Ranges that include “now” also enable live following (below). |
| Verbosity | A severity floor: Errors, Warnings, Info, or Debug. Higher floors hide less-severe entries. |
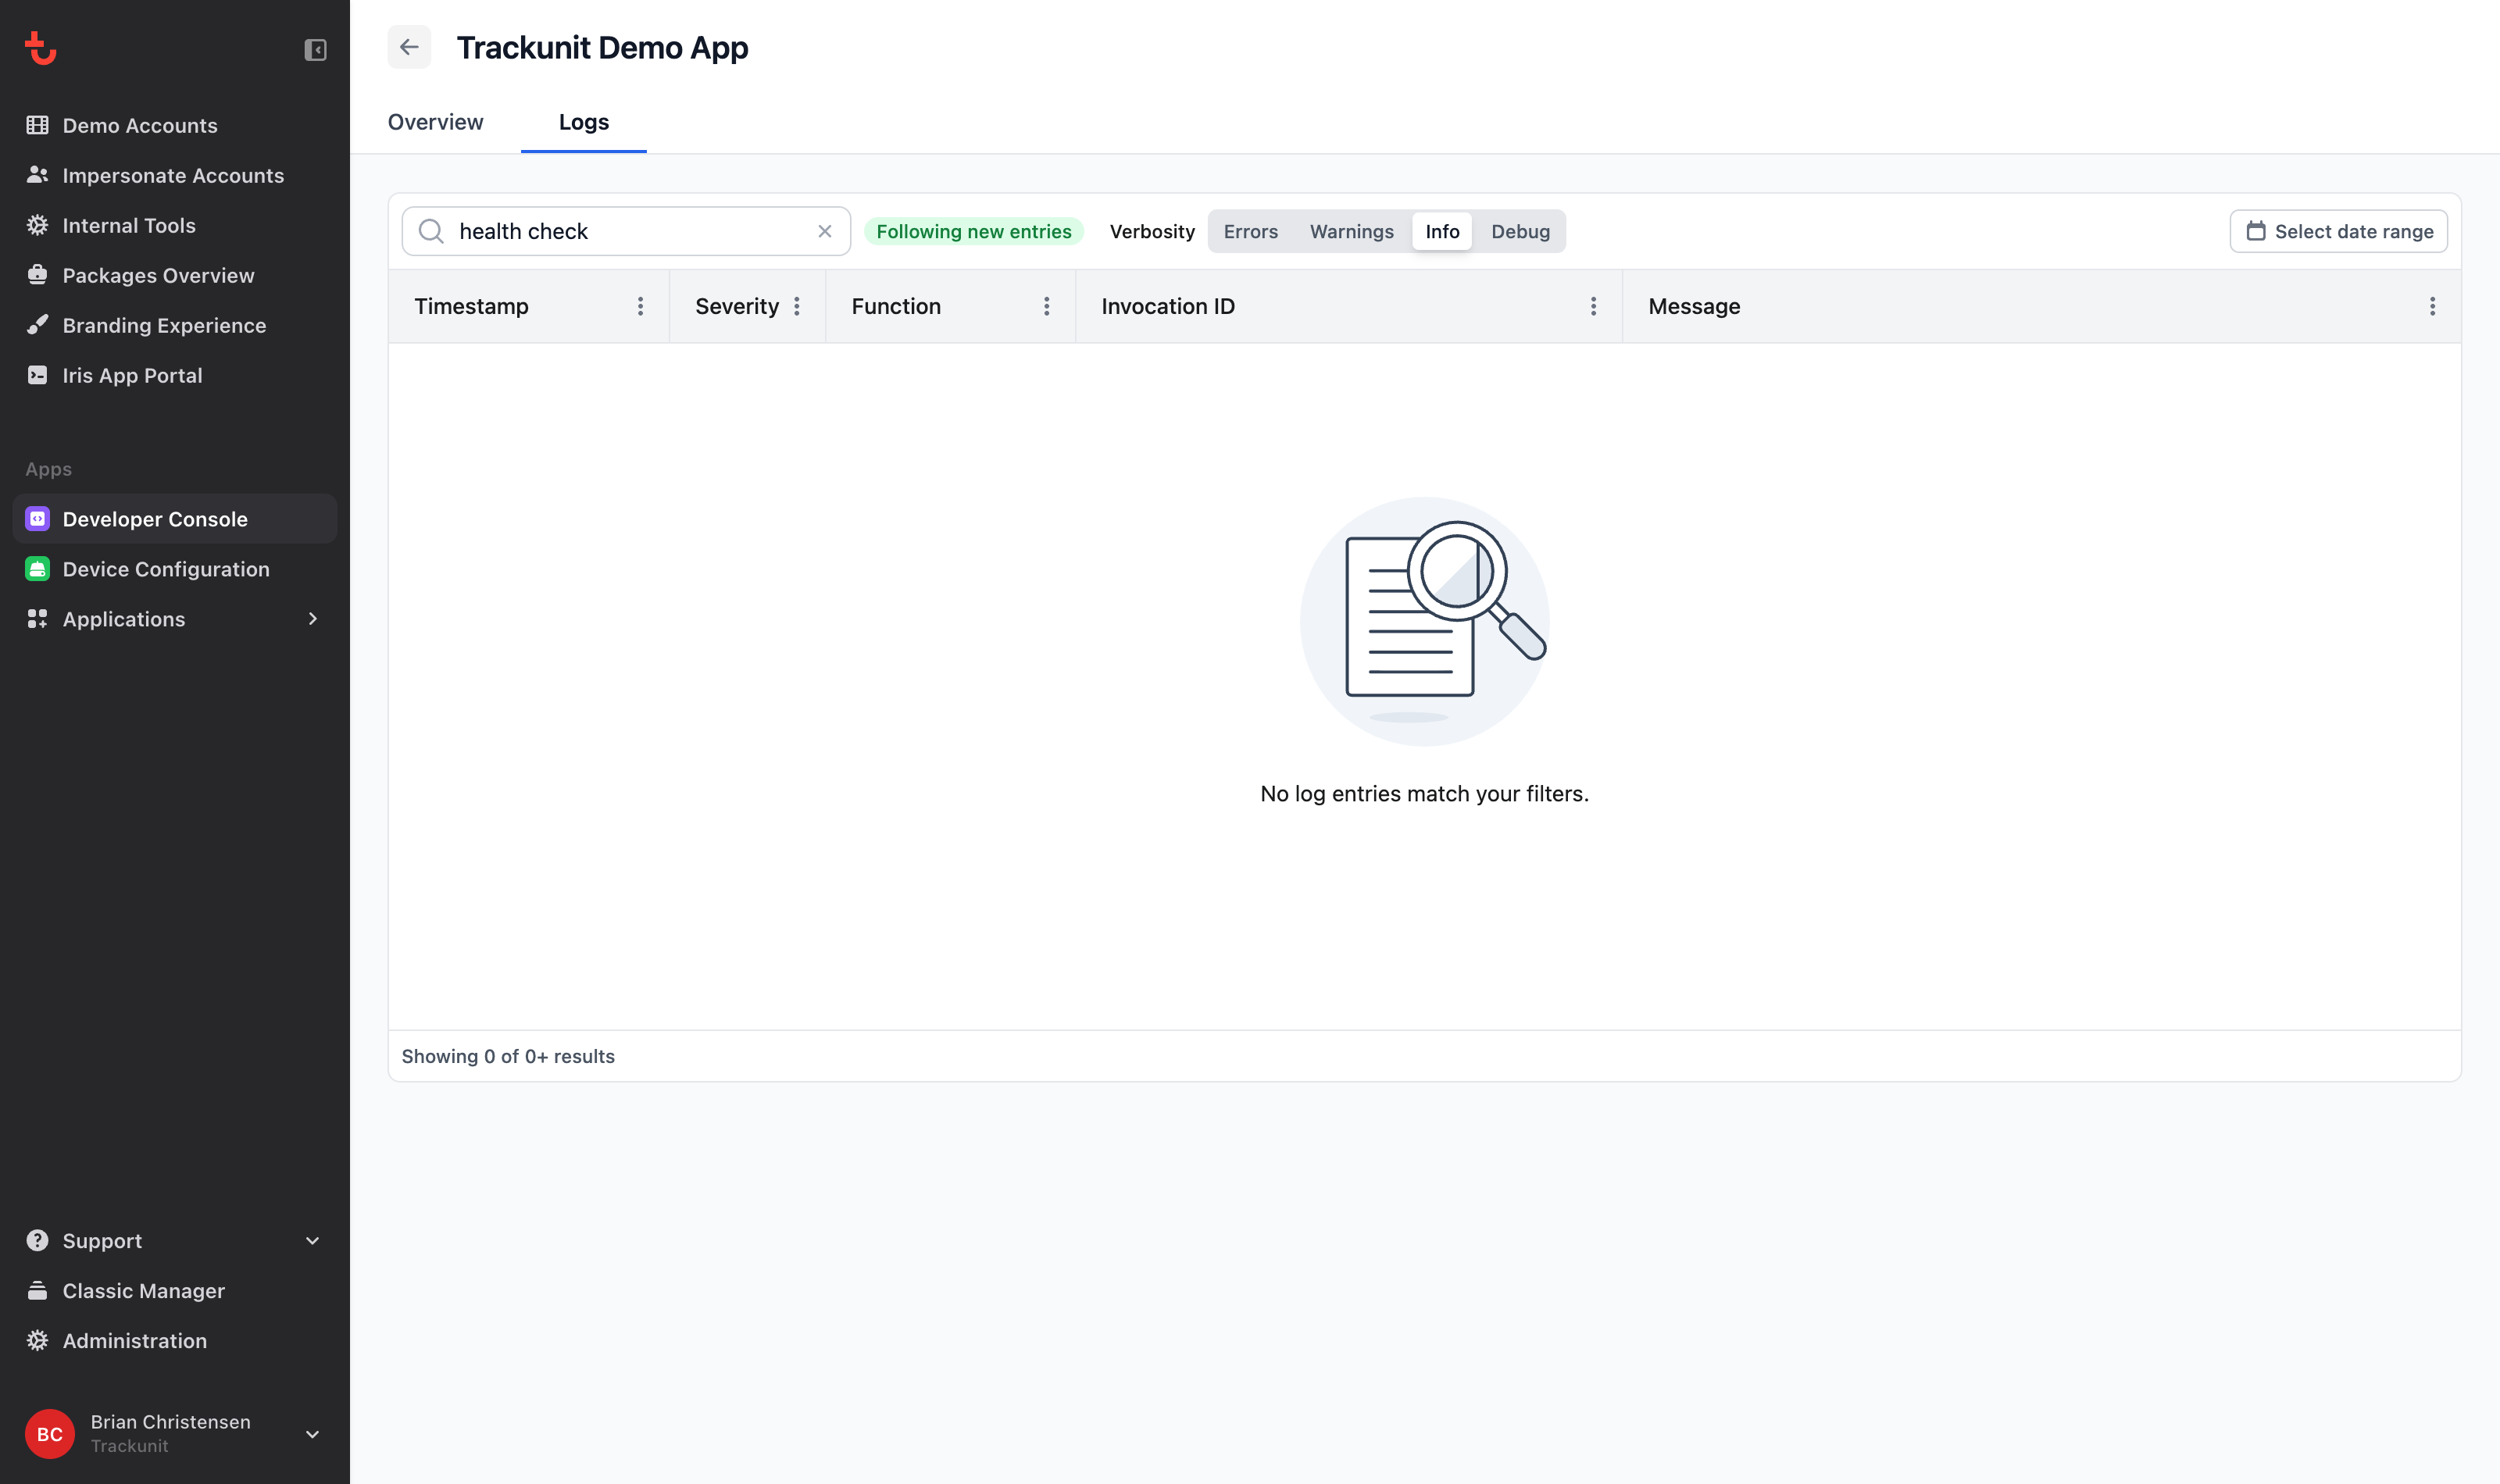
| Search | Filters by text in the message or function name. Matching is case-insensitive. |
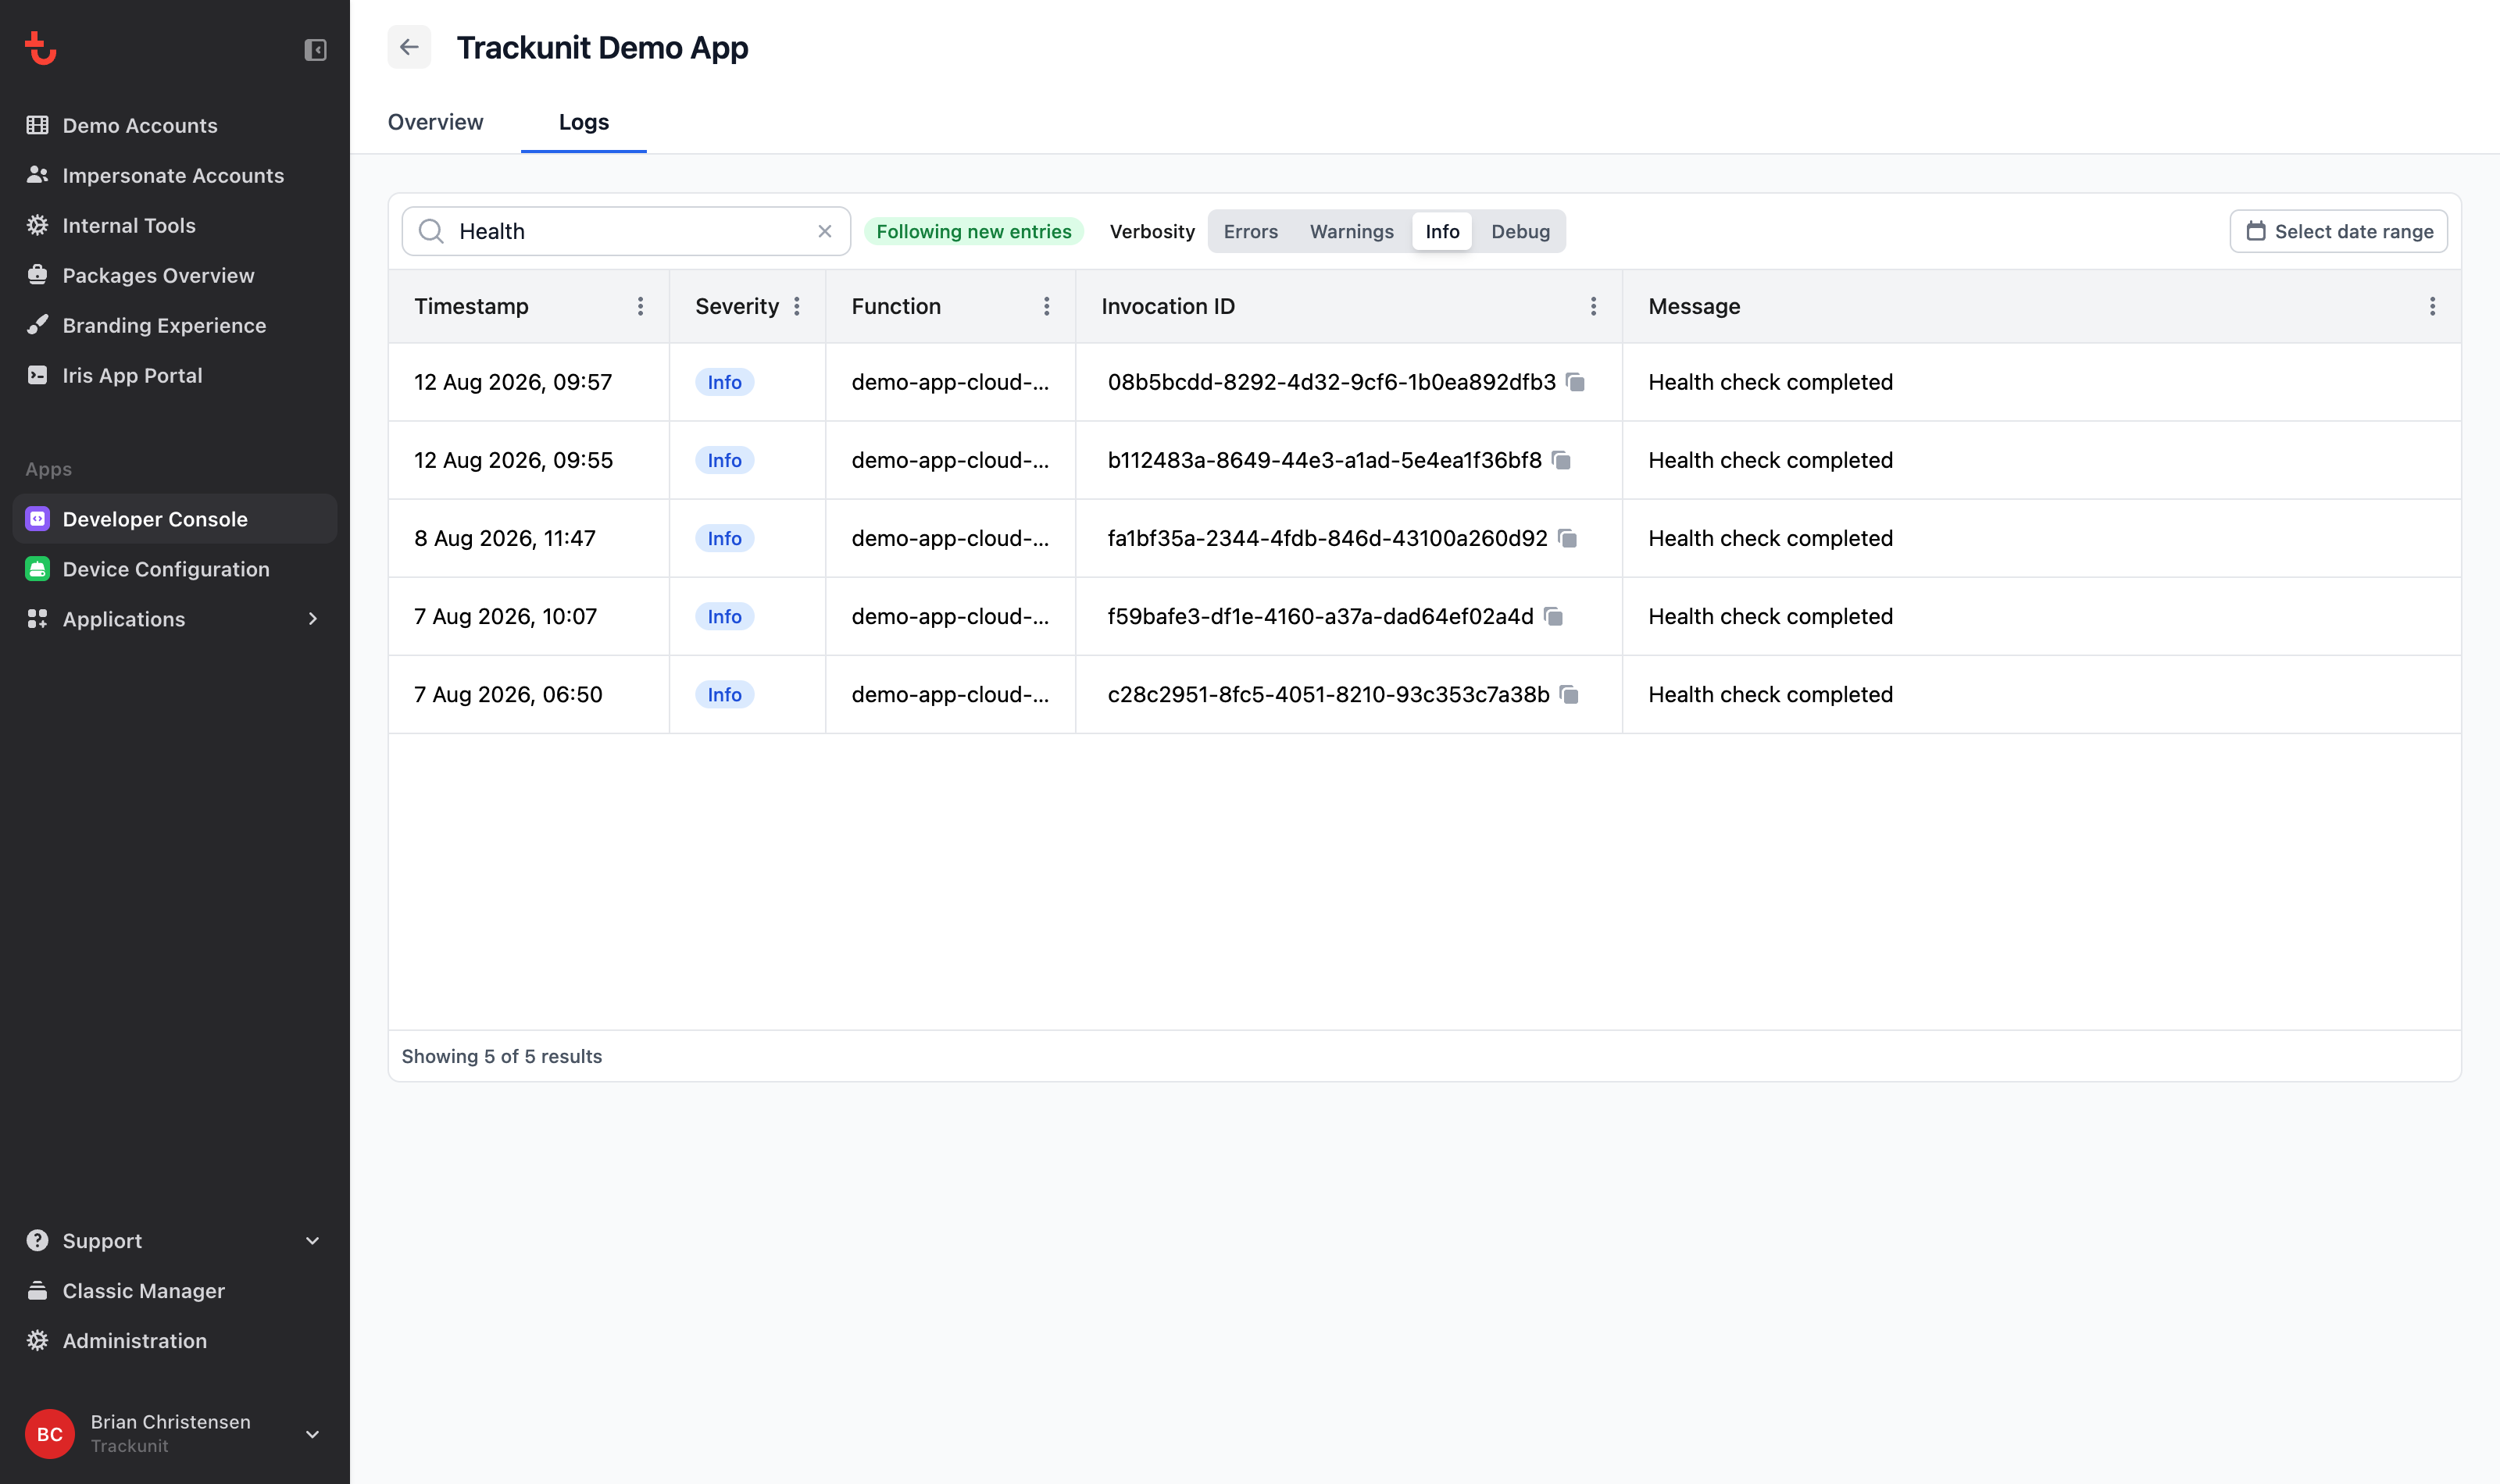
Scroll the table to load more historical pages when available.
Follow live entries
When the selected date range includes the present, the Logs tab follows new entries as they arrive. A Following new entries indicator appears next to the search field.
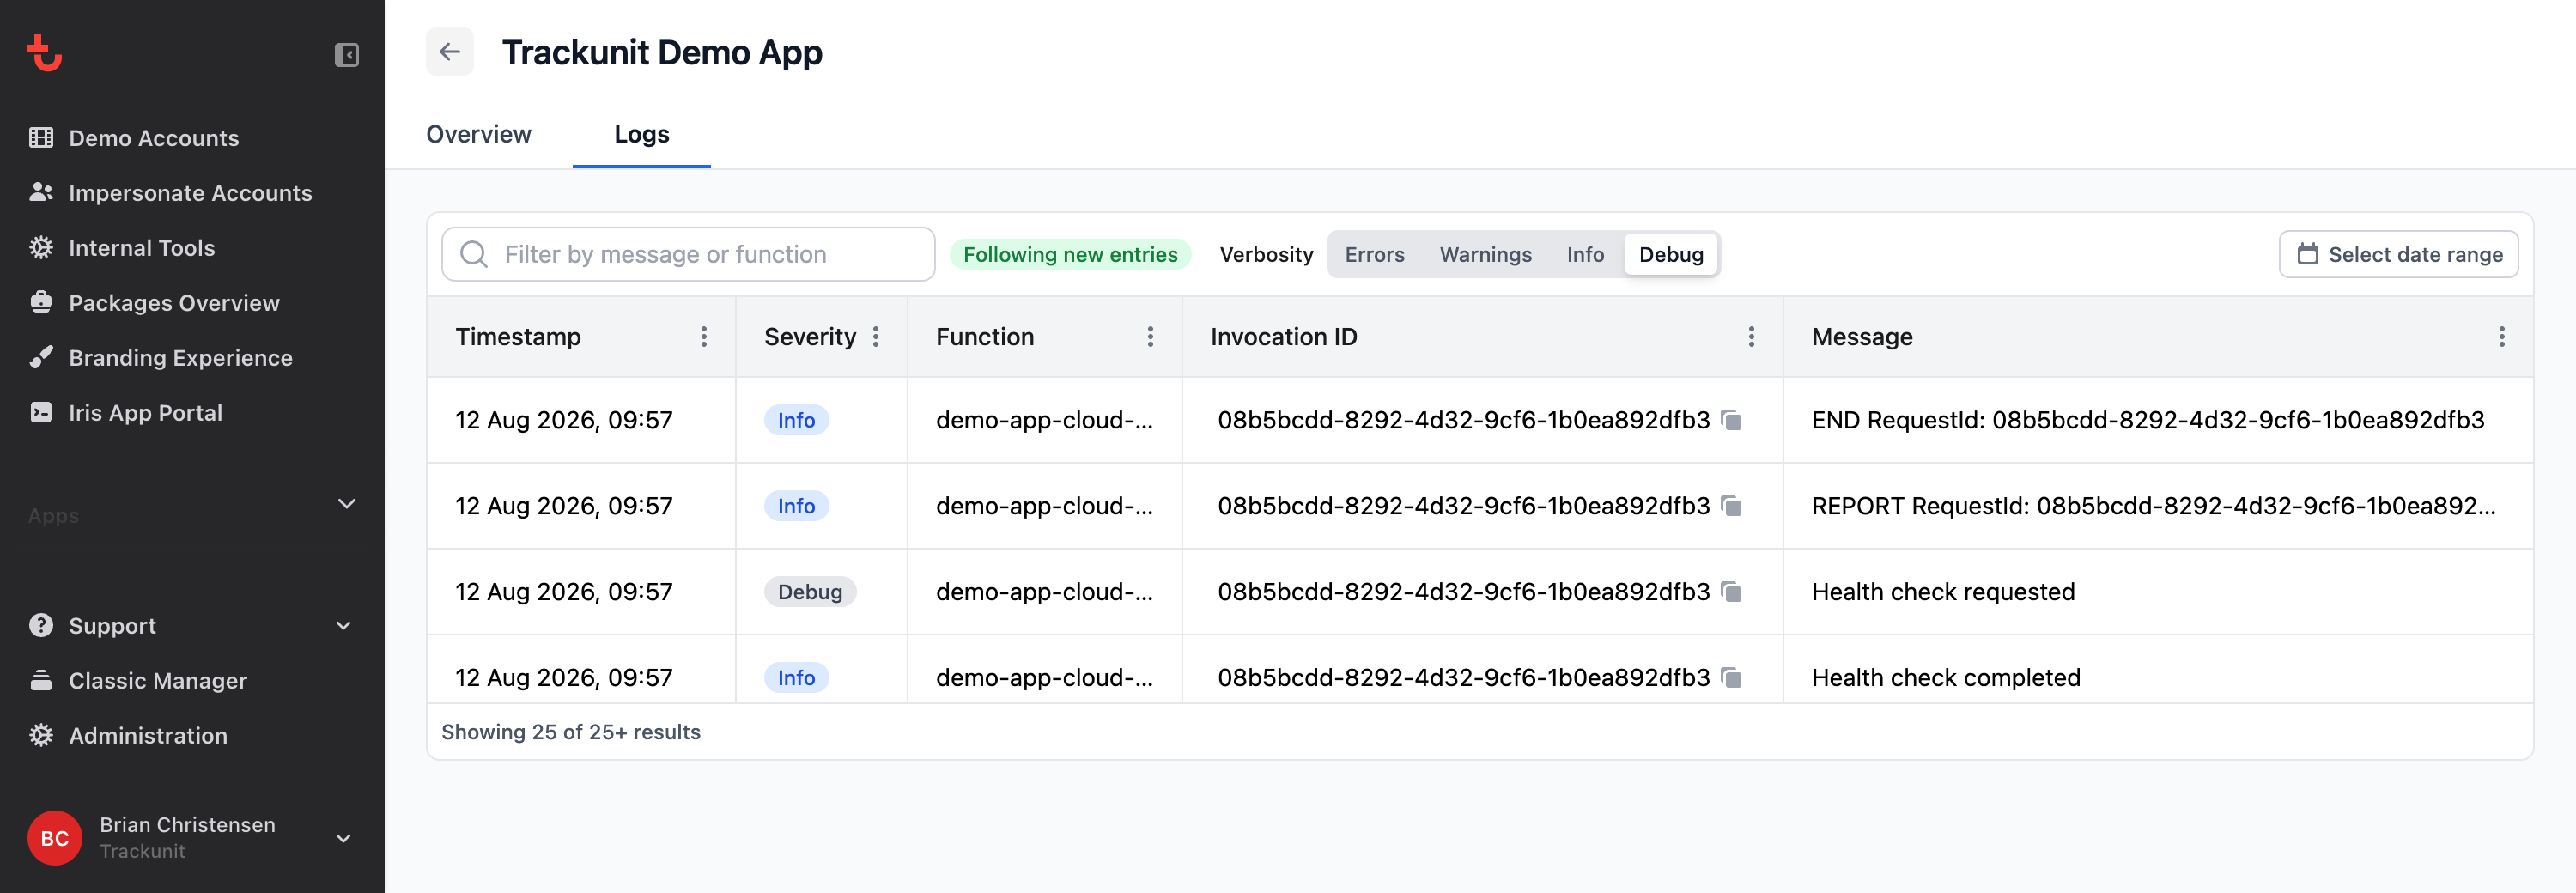
If your date range is entirely in the past, live following is off — change the range to include now to stream again.
Inspect a log entry
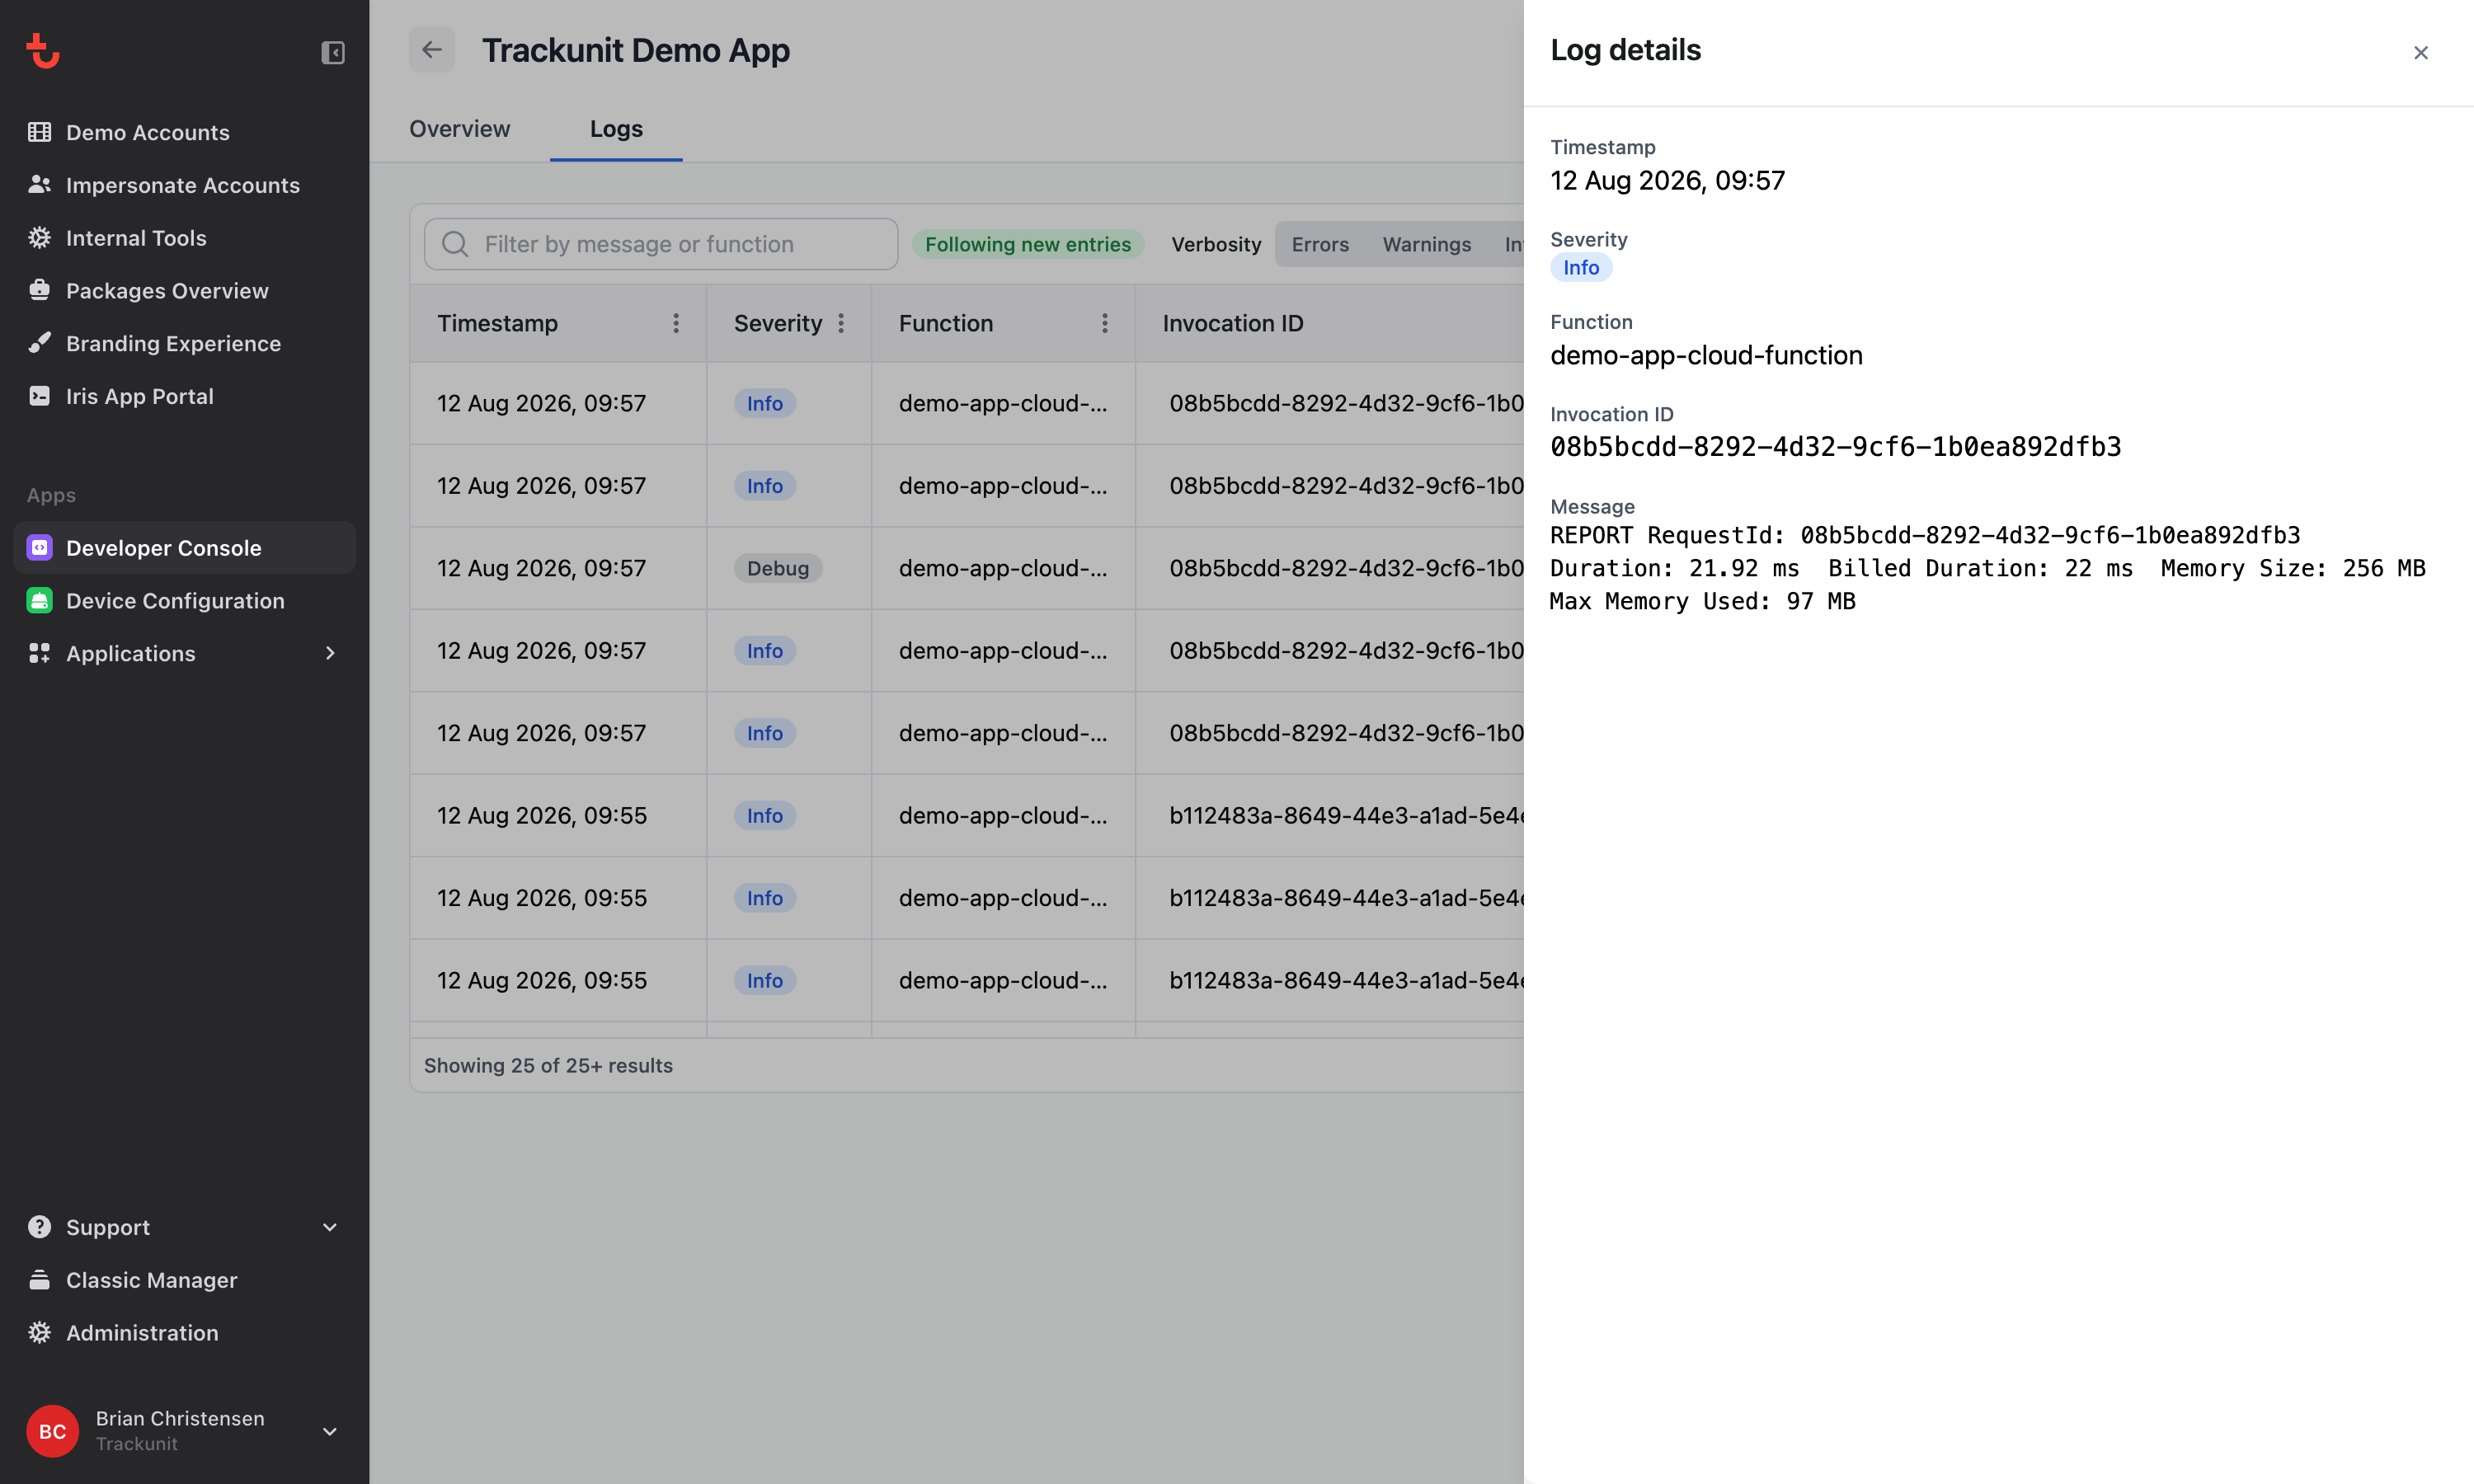
Click a row to open Log details, including timestamp, severity, function name, invocation ID, and the full message.
Empty, error, and access states
| Situation | What you see |
|---|---|
| No entries in the selected window (and no active filters) | No log entries yet for this time range. |
| Filters exclude everything | No log entries match your filters. |
| Load failure | Couldn't load logs with a Try again action when retrying is possible. |
| Not the app owner | You don't have access to these logs — only the app owner can view serverside function logs. |
Related
- Calling external APIs from an Iris App — serverside execution overview
- Prerequisites — enabling Developer Console